A day at work with ITBI

The case: DNB
Background
DNB is Norway’s largest financial services group and among the top 5 in the Nordic region. The group offers a broad range of financial services and has several international branches and representative offices, among these operations in Sweden and private banking in Luxembourg. The bank employees over 9.500 people and has around 2 million private customers and 210.000 corporate customers.
DNB’s IT system landscape
Like most banks, DNB has a multitude of legacy systems over a score of partitions. Even if their functioning and trends are well known by the employees, when new problems arise it is not always clear from where the issues are originating. DNB has outsourced their mainframe infrastructure and run application development in-house.
This really calls for fact-based reporting to stay on top of the complexity.
DNB’s IT Department consists of 830 people, of which a group of 5 are employed in the Application and Platform Optimization.
Monitoring tools vs. ITBITM
Detailed analyses are conducted with different tools such as TMON, SDSF and Detector (DB2), which makes a lot of sense since many issues are created in SQL. Monitors, however, do not provide the best starting point to find out where the problem comes from.
“This is where working with ITBI has become my daily starting routine” says Audun Faaberg, Performance Specialist at DNB.
“ITBI allows me to see trends and to easily conduct comparisons across time so that abnormalities become immediately apparent and my attention can be focused on the important changes.”
“I am personally especially happy to work with the “Hyper Drill” function, which lets me feel a bit like a deep dive nerd but that’s fine! There, I typically click on “Job & Task” and look at this day and the 5 last business days so I can examine this day compared to the last days, and look at how it compared to the last same day in the previous week, for instance a Friday with the previous Friday.
I always start by looking at the time-range 8-16 because the payment to our outsourcer is based on the peak in those hours. After looking at the banks opening hours, I look at the time between 4 in the afternoon and 8 next morning because even if the payment is not dependent on peaks in this time slot, bad code is still bad code no matter when it creates issues. If anomalies are detected in the trend analysis or time comparison, working with a monitor and application performance management tools is relevant because now I know where to look and what to look for.”
During summer for example, thanks to ITBI, an unusual change in MIPS usage in an integration server was detected.
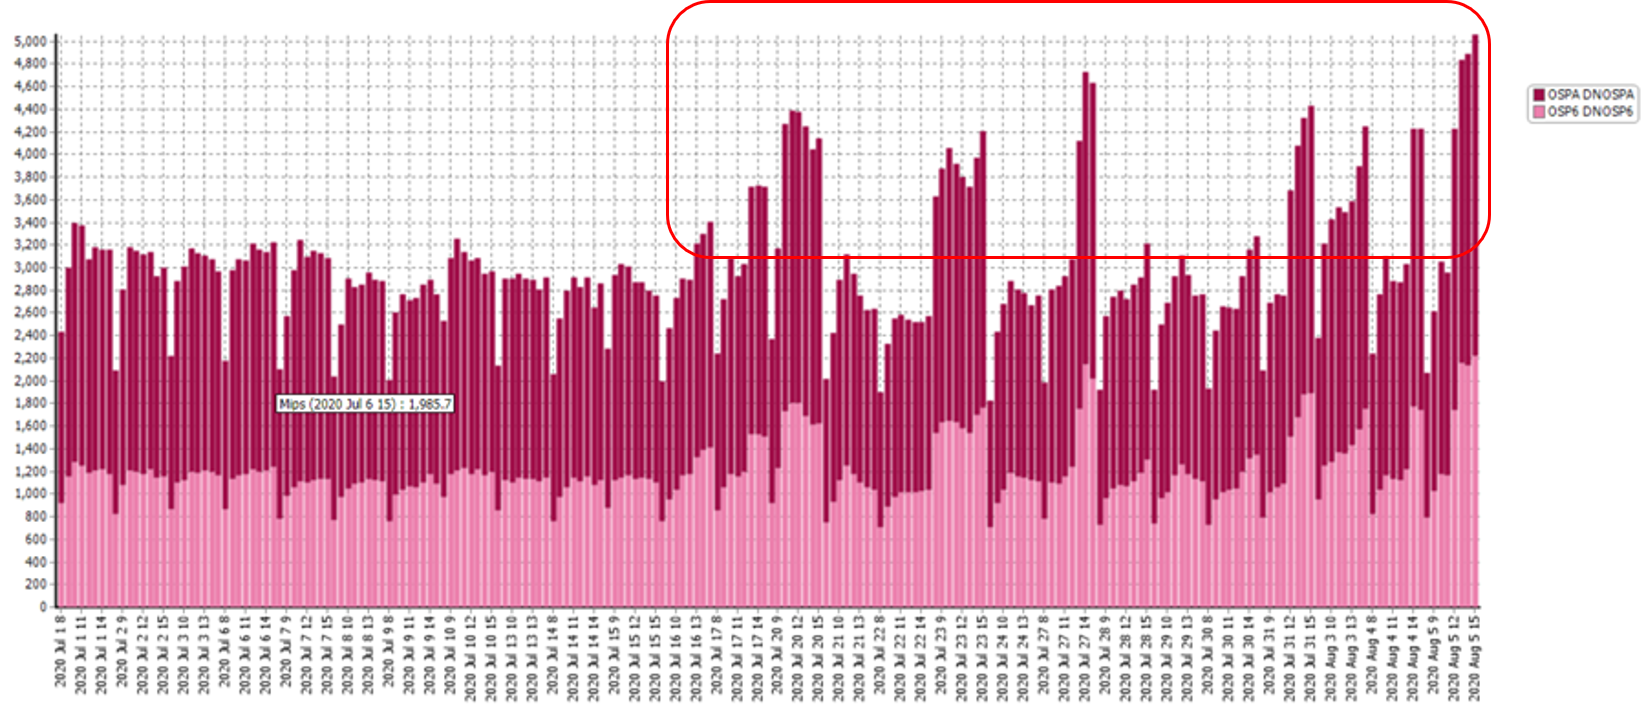
This was peculiar, since it started in the last half of July – the holiday month in Norway – thus in the summer freeze in the Change management system. No system changes had been done.
“We started noticing peaks in just 2 of the z/OS partitions – says Audun. Immediately, we sent the graphs evidencing the anomality to “the usual suspects” (yes – we do have such a list!), and after 2-3 rounds, finally a group stepped forward. A service had gone live with changes some time earlier, but had not been used until July. From a functional point of view, everything was fine. The problem was caused by a data check running twice. Testing had been performed using low transaction volumes and the issue had therefore not been detected before.”
“We have found quite some errors in this way. It is great to have a tool that helps me detecting these anomalies so I can act on them fast and thereby help the company saving significant amounts of money and offering our customers a better service.” says Audun.
The ITBITM difference
“Where ITBI really makes the biggest difference for me is that it facilitates the analysis of long-term trends, and the detection of anomalies. I also use it to watch the effect over time of the mitigating actions we take and as part of our management reporting.”
-
 Audun FaabergPerformance Specialist at DNB