Guide:
Report builder.
To be able to build your own reports or modify existing reports, there are some prerequisites.
- Your user level is BI Advanced or BI Developer
- You must have the Targit Designer Client downloaded and installed on your PC
- You need a basic understanding of the data
With the BI Advanced user access, you have access to the Designer Client to build or modify BI reports and are able to save the reports to your personal folder.
With the BI Developer user access, you have access to the Designer Client to build or modify BI reports, can save the reports to your personal folder, and are able to share your created reports with your organization.
Login to the Targit Designer Client
- Open the Targit Designer Client
- Login with: <CustomerName>.smtdata.com where <CustomerName> is the name of your company.
- Now you can choose between three options to log in to Targit with – choose Azureb2c
- A browser window will open, where you log in with your ITBI credentials.
- When you’ve received the message “Received authorization code. You may now close this window.”, you can go back to the Targit Client
Building your BI reports
When you have the Targit Client open, there’s two ways to start building your own BI report:
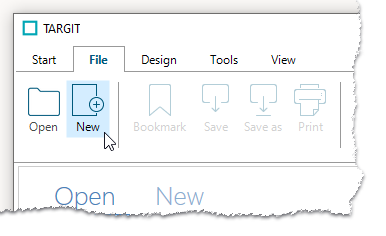
- Click on File, then click on New, and then select Blank dashboard under Standard template.
or
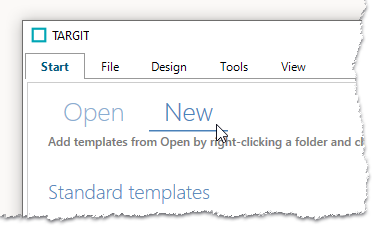
- On the Start tab, click on New and select Blank dashboard under Standard templates.
The “Blank dashboard” template is a BI report which lets you create interactive reports with dynamic content, whereas the template “Blank report” is intended for static, printable reports.
Having selected a “Blank dashboard” template, you can now begin to add objects to your blank page. We recommend starting with adding a Crosstab – you can always customize it into a graph of your choosing afterwards.
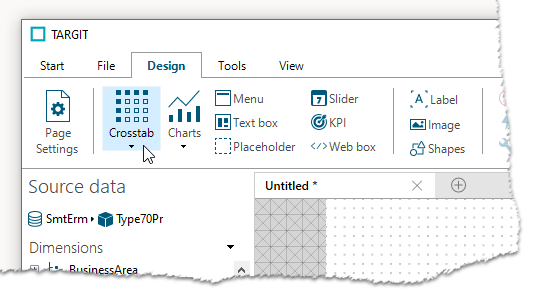
In the crosstab you select your Source data from the sidebar. First you choose which cube data you want, and then you select your dimensions data and your measurement data.

Then go to the Criteria tab and add global criteria. In this example we choose Calendar Date = 2017 as one of the criteria, Measure = Processor Dispatch Time as a second criteria, SumLevel = Detail as a third criteria, and Processor Type CP as a fourth criteria for the crosstab. You always need to select Measure and SumLevel as criteria, and preferably Calendar too.

When you’ve selected all your criteria, click OK, and click on the little lightning symbol – and now your crosstab is filled with data.

Under Source Data it’s also possible to add a criteria bar under dimensions, by right-clicking on the dimensions you want for a more dynamic and responsive dashboard.
You can change the crosstab’s look by going to the Properties tab and selecting the graph you want under Object Type. You can also change how the data is shown, and graphically design it to your liking.
On Targit’s documentation webpage, you can find more guides on styling.
TARGIT documentation community
Saving your BI Report
When you’re satisfied with your BI Report/dashboard, you go to the File tab in the top bar and click Save as.
If you’re a BI Advanced user, you can save it to your personal folder, and if you are a BI Developer user you can both save it within your personal folder and share it with your colleagues in the Shared folder called “ITBI Customer”. Once you place a file here it will automatically get copied to the ITBI\Customer folder and be visible in the portal.
You are always welcome to contact SMT Data for additional information and learning sessions.